


Understanding Latency & Key Strategies to Optimise Application Performance

In my previous post Performance Monitoring 101 to improve performance, we need to minimise Latency between Request & Response and maximise Throughput with Concurrency. In this post, we will concentrate on some of the main types of latencies and how to tackle them.
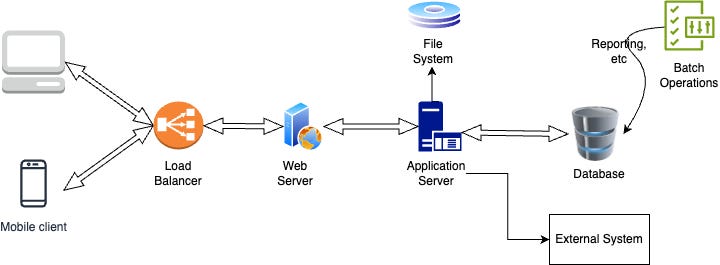
We will take this as our application architecture for reference purposes.
Network Latency
In a typical application setup (Figure 1), there are usually two types of networks involved: Internet and Intranet.

- Internet: Interactions between the client and the load balancer, the application server and any external systems typically occur over the Internet.
- Intranet: Interactions between internal components like the load balancer, web server and application server happen over the Intranet.
Internet connections involve multiple hops, leading to higher latency, unreliability, and slower performance compared to intranet connections.
To establish a TCP connection over the internet, the client initiates a connection that the server acknowledges, requiring one round trip. However, when using HTTPS (SSL), three round trips are needed—one for the TCP connection and two for SSL key exchange. After these round trips, data can be exchanged between the client and server, totalling four round trips for the initial connection.
The more connections established with the server, the greater the perceived slowness.
Strategies to Reduce Network Latency
1. Position Servers Closer to Clients: Position your servers near your primary customer base. For instance, if most customers are in India, hosting servers in India reduces the number of network hops, lowering latency.
2. Content Delivery Networks (CDNs): CDNs use geographically distributed servers to bring content closer to users, reducing the physical distance data needs to travel.
3. Connection Pools: Reuse existing connections wherever possible, including intranet connections, to avoid the overhead of repeatedly creating new connections.
4. Upgrade to HTTP/2 or HTTP/3: Use modern versions of HTTP, such as HTTP/2 or HTTP/3, which support multiplexing and reduce latency compared to older versions like HTTP/1.1.
5. Cache Data: Avoid transferring data between clients and servers when possible. Cache static data, session data, and database query results to save time.
6. Data Compression: Compress data before transmission (e.g., using gzip) to reduce the amount of data sent over the network. Minify JavaScript, CSS, and HTML files to decrease their size.
7. Use Efficient Data Formats: For communication between microservices, consider RPC calls for efficient data transfer. For images, use formats like WebP, which offer better compression, if supported by the client’s browser.
These strategies can significantly reduce network latency, improving the responsiveness of your application.
Memory Latency

Accessing data from RAM is generally quick, especially with modern RAM like DDR4 or DDR5. However, latency issues can still arise due to factors such as:
Improper Memory Allocation: Allocating insufficient sizes for heap memory or database buffer memory can lead to performance bottlenecks.
Exceeding RAM Capacity: When memory usage exceeds the available RAM, two major problems can occur:
Swap Memory Usage: Excess data spills over to swap memory on the hard disk, which is much slower than RAM.
Aggressive Garbage Collection: To free up memory, the system may frequently trigger garbage collection, slowing down the application and causing performance issues.
Strategies to Reduce Memory Latency
Optimize Memory Usage
Avoid Unnecessary Object Creation: Minimize the creation of objects, especially in loops and reuse objects when possible using techniques like object pooling.
Choose Efficient Data Structures: Use the most memory-efficient data structures; for example, prefer ArrayList over LinkedList for random access.
Clean-Up Code: Remove unused code and variables, as even the codebase consumes memory.
Detect and Fix Memory Leaks
Identify Memory Leaks: Use profilers to detect memory leaks caused by objects that are not properly dereferenced, especially in growing collections.
Manage Shared Objects: Monitor shared objects, as they can grow unexpectedly due to multi-threaded access. Avoid creating shared objects whenever possible.
Implement Efficient Caching Strategies
Use Size-Limited Caches: Implement caches with size limits and eviction policies like LRU (Least Recently Used) to prevent unbounded memory growth.
Offload Large Caches: For large caches, consider using external solutions like Redis or Memcached to reduce heap memory usage.
Tune Garbage Collection
Adjust GC Parameters: Tune garbage collector parameters and select the appropriate garbage collector based on your application’s needs.
Choose the Right Garbage Collector: Use collectors that minimize pause times for real-time applications and batch-processing collectors for batch jobs where pauses are acceptable.
Review Third-Party Libraries
Select Memory-Efficient Libraries: Choose third-party libraries carefully, focusing on those known for efficient memory usage, especially when handling large datasets.
Keep Libraries Updated: Ensure that libraries are updated to leverage any performance improvements or memory optimizations.
Database Memory Optimizations
Properly Configure Buffer Memory: Ensure that the database buffer memory is configured correctly to optimize performance.
Normalize or Denormalize Data: Choose data normalization or denormalization based on your specific needs; normalization is generally preferred, but denormalization can be advantageous in certain scenarios.
Disk Latency

Disk I/O is one of the slowest types of I/O operations, yet it’s crucial for many tasks, including database operations (select, insert, update, etc.) and accessing static files like images. While disk latency can be a significant bottleneck, sequential writes, such as logging, tend to be faster. For performance-critical applications, asynchronous logging is recommended.
Strategies to Reduce Disk Latency
Use Caching Mechanisms
Application-Level Caching: Implement in-memory caching solutions like Redis or Memcached to minimize direct disk access and speed up data retrieval.
Web Content Caching: Use reverse proxies like Nginx to cache static content such as images, HTML, and CSS, reducing the need to fetch these files from disk repeatedly.
Use Faster Disk I/O Options
Upgrade to SSDs: If you haven’t already, switch to SSDs, which provide significantly faster read and write speeds compared to traditional HDDs. Choose the SSD type that best fits your needs, as cloud providers offer various performance tiers.
Database Optimization
Data Normalization: Properly normalize data to avoid loading large, repetitive datasets from disk, which can slow down performance.
Index Management: Create indexes where necessary to speed up data retrieval, but avoid excessive indexing as it can degrade write performance.
Query Optimization: Optimize database queries by selecting only the required data and avoiding unnecessary data access, which reduces I/O load.
CPU Latency

The CPU is the core component that drives overall system performance, making it crucial to minimize latency for optimal efficiency. Usually it happens mostly due to our inefficient coding & context switching.
Strategies to Reduce CPU Latency
Efficient Algorithms & Data Structures
Latency often arises from using inefficient algorithms or data structures, and selecting the right ones for specific tasks can greatly improve performance. This challenge is closely tied to developers' choices, so there isn't a one-size-fits-all solution. It's essential to find the right tools for the job rather than relying solely on familiar methods.
Batching Operations
Batching operations like I/O and database queries can save CPU time by reducing the frequency of context switching and minimizing the overhead of connection creation (e.g., HTTP or database connections). This improves processing speed by handling multiple tasks in a single operation.
Optimize Multithreading and Concurrency
Use lock-free or low-lock algorithms to reduce contention between threads, enhancing CPU core utilization and reducing latency.
Manage thread overhead with thread pools to minimize context switching. Set the thread pool size to match or slightly under the number of available CPU cores to optimize resource usage. But it totally depends if tasks are not CPU intensive tasks then the thread pool size could be a different number.
Latency Numbers Every Programmer Should Know
| Latency Comparison Numbers (~2012) | |
| ---------------------------------- | |
| L1 cache reference 0.5 ns | |
| Branch mispredict 5 ns | |
| L2 cache reference 7 ns 14x L1 cache | |
| Mutex lock/unlock 25 ns | |
| Main memory reference 100 ns 20x L2 cache, 200x L1 cache | |
| Compress 1K bytes with Zippy 3,000 ns 3 us | |
| Send 1K bytes over 1 Gbps network 10,000 ns 10 us | |
| Read 4K randomly from SSD* 150,000 ns 150 us ~1GB/sec SSD | |
| Read 1 MB sequentially from memory 250,000 ns 250 us | |
| Round trip within same datacenter 500,000 ns 500 us | |
| Read 1 MB sequentially from SSD* 1,000,000 ns 1,000 us 1 ms ~1GB/sec SSD, 4X memory | |
| Disk seek 10,000,000 ns 10,000 us 10 ms 20x datacenter roundtrip | |
| Read 1 MB sequentially from disk 20,000,000 ns 20,000 us 20 ms 80x memory, 20X SSD | |
| Send packet CA->Netherlands->CA 150,000,000 ns 150,000 us 150 ms | |
| Notes | |
| ----- | |
| 1 ns = 10^-9 seconds | |
| 1 us = 10^-6 seconds = 1,000 ns | |
| 1 ms = 10^-3 seconds = 1,000 us = 1,000,000 ns | |
| Credit | |
| ------ | |
| By Jeff Dean: http://research.google.com/people/jeff/ | |
| Originally by Peter Norvig: http://norvig.com/21-days.html#answers | |
| Contributions | |
| ------------- | |
| 'Humanized' comparison: https://gist.github.com/hellerbarde/2843375 | |
| Visual comparison chart: http://i.imgur.com/k0t1e.png |
The two references above are widely used to quantify latency numbers that we might encounter under various scenarios. While they may not reflect the latest data, they provide a useful relative comparison to understand potential performance impacts.
FYI: n - nano, µ - micro, m - milli
CPU level (1 ns - 10 ns): L1 & L2 caches are integrated into the microprocessor chip itself so if we are playing with the data at this level things happen below 10ns speed.
RAM level (100 ns): Accessing data from RAM takes about 100 ns. Since Redis is an in-memory data store, reading data from it typically takes around 100 ns.
Data Compression (2 µs - 3 µs): Data compression is much faster that’s why it is always better to compress the data and transmit it.
Intranet level (500 µs or 0.5 ms): If we need some data from a separate Redis server which is present in the same data centre then requesting and getting that back to our server takes less than a millisecond.
SSD level (1 ms): Reading 1 MB of data from a hard disk(SSD) or Inserting data in the Database including storing the data, updating indexes, and flushing logs, often takes about 1 ms.
Internet level (150 ms): A third-party API call such as from one continent to the other continent and back, can experience a latency of around 100 ms.
These numbers provide a clear understanding of expected latencies when designing application architecture. With this reference, we can make more informed decisions and anticipate potential performance impacts accurately.