


Performance Monitoring 101: What to Monitor and Why for a Faster, More Reliable Application

What is Performance?
The responsiveness of a software application in meeting user requirements on a given hardware setup and load(volume of requests).
When you get a complaint saying your application is running slow, if your default answer is to increase the server capacity but never monitor your application then it might get you off the hook once or twice but eventually you will have a hard time.
That’s why you need to monitor your application performance.
“What gets measured gets improved.” - Peter Drucker
If you want to improve your application’s performance then the first step is to measure it.
What does the Performance problem look like?
It is somewhat similar to a traffic jam.

When one vehicle (request) gets stuck, it causes others to get stuck as well. This affects many vehicles (requests) that follow the same route (server), causing them to experience delays even after the initial vehicle has long passed.
What are the usual suspects/reasons for Performance Problems?
Inefficient Coding
Bad business logic, Memory Leaks, Unoptimized Queries, Choosing wrong data structures, Lack of Caching, Serial Processing, etc
Configuration Issues
Load Balancer Misconfiguration, Incorrectly configured thread pools, Incorrect memory allocation, etc
Insufficient resource capacity
Insufficient CPU or Memory, Disk I/O Bottlenecks, Network Latency, Server Overload, etc
Environmental Factors
Slow or unreliable Third-Party Services, OS patches/Software Updates, An unexpected spike or usage in user activity, Security issues like DDoS Attacks, Malware, etc
Objective
Usually, our objective is to improve performance, which will be to Minimise latency between Request & Response and Maximise Throughput with Concurrency.
A simple application architecture looks like below.
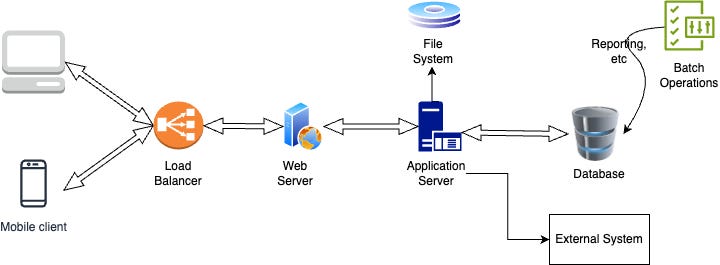
What is latency?
The delay between a request and its corresponding response.
Latency = Wait time (Waiting time for this request to pick up at multiple components of the system like Each Microservice, Database, etc) + Processing Time (Time taken at the time of processing in multiple components of the system)
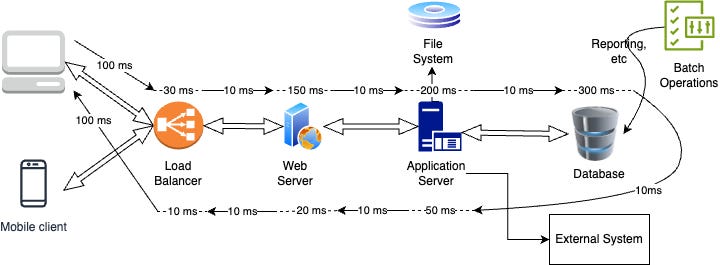
Here the dotted lines represent processing time and the continuous line is the wait time. Here the latency is
Latency = 1010 milli seconds (100 + 30 + 10 + 150 + 10 + 200 + 10 + 300 + 10 + 50 + 10 + 20 + 10 + 100)
What is Throughput?
The amount of work the application can process within a given time frame. This is often measured in transactions per second, requests per second or data processed per unit of time.
Throughput depends on Latency & Hardware Capacity.
What is Concurrency?
The ability of a system to handle multiple tasks or operations at the same time. We can say how many tasks are in progress simultaneously, whether they are executing fully in parallel (on multiple processors) or are interleaved in time (on a single processor).
Performance Monitoring Themes
There is kind of 4 themes to monitor an application.
Latency
Because it affects user experience. It should be as low as possible.
Based on several studies conducted every second delay in your page leads to 11% fewer page views, a 16% decrease in customer satisfaction & 7% loss in conversions.
More than 10 years ago, Amazon found that every 100ms of latency cost them 1% in sales.Throughput
It will give us a fair idea of how many users the application serves/support. It should be higher than the peak time traffic.
Note: Concurrency is a great thing to have but without great throughput, it doesn’t matter that much. In the process of concentrating throughput, we touch concurrency too so as a theme throughput makes sense.
Errors
This is self-explanatory and we all strive to make it 0 but it is an almost impossible task so it should be as little as possible. It’s better to track in percentage terms.
At the time of testing, it’s ok to have time-out errors, not functionality errors.
Resource Utilisation
How our hardware or you can say cloud resources are utilised whether they are touching 100% of their capacity or at the permissible level. If we don’t monitor them then we will get surprises like the disk is full or memory full or 100% CPU issue or the Network is choked, etc. Sometimes there is a chance we are underutilising it then we are unnecessarily paying the bill.
One more thing we need to look into is Tail Latency. It is part of Latency only but many times we see it from an average lens because of that we miss this part and most of the future problems linger in the Tail Latency area only.
What is Tail Latency?
The latency experienced by the slowest or "tail end" of requests in a system. It's a measure of the worst-case performance, often expressed as the 95th, 99th, or 99.9th percentile of response times.

In simpler terms, tail latency is concerned with the delays that occur in the slowest 1%, 0.1%, or even 0.01% of requests. These requests take much longer to process compared to the majority, and although they are few, they can significantly impact the overall user experience, especially in large-scale systems.
Key Metrics to Monitor
Monitoring the key metrics of your application’s performance is important to keep them running smoothly. These differ from your application type. If it is for a mobile application then we look at different metrics for a web application we look at different ones. In the web application also we will monitor different metrics for frontend & backend.
"You can't manage what you can't measure." - Peter Drucker
If you monitor your application well you can identify issues before users complain, optimize performance and resource utilization and make informed decisions to improve the user experience and of course, achieve business objectives.
1. Requests rate
The request rate refers to the number of requests your application or servers receive within a particular time period. Monitoring this metric helps you understand the load on your system and track how it changes over time. A sudden spike in request rate could indicate increased user activity or potentially harmful events like a DDoS attack.
2. Response Time
Response time is the duration it takes for your application to respond to a user request. Monitoring average and tail response times (e.g., 95th or 99th percentile) provides insights into how quickly your system is responding to users. High response times can indicate performance bottlenecks in your application.
3. Error rate
Error rate measures the percentage of requests that result in errors. This could be HTTP errors (e.g., 4xx or 5xx status codes) or application-specific errors. A rising error rate is often a red flag that needs immediate attention, as it can indicate failing services or broken functionality.
4. Throughput
Throughput refers to the number of transactions or operations your application can handle within a given period. High throughput is desirable, but it must be balanced with response time to ensure a good user experience.
5. Resource Utilization
Resource utilization metrics, such as memory, CPU, disk, and network usage, provide a clear picture of how efficiently your application is using its resources. Monitoring these helps prevent over-utilization or under-utilization, both of which can lead to performance issues.
6. Disk I/O
Disk I/O measures the speed at which data is read from or written to the disk. High disk I/O can indicate bottlenecks, especially in database-heavy applications. Monitoring this metric helps in identifying issues with storage subsystems.
7. Database Query Performance
Monitoring the performance of your database queries is essential, especially for applications with heavy database interactions. Metrics such as query response time, slow queries and the number of queries per second help you identify and optimize inefficient database operations.
8. Network Latency
Network latency is the time it takes for data to travel from the user to the server and back. High latency can lead to poor user experience, especially in real-time applications. Monitoring network latency helps in identifying network issues or slowdowns.
9. Tail Latency
Tail latency focuses on the slowest requests, often measured at the 95th, 99th, or 99.9th percentile. Monitoring tail latency is critical because it reveals the worst-case performance scenarios that can severely impact user experience.
10. Uptime/Downtime
Uptime measures the amount of time your application is available and operational. Monitoring uptime and downtime is crucial for maintaining high availability and meeting service-level agreements (SLAs). Automated alerts for downtime can help you respond quickly to outages.
11. Apdex Score
The Apdex (Application Performance Index) score is a user satisfaction metric that ranges from 0 to 1. It is calculated based on the response times and the percentage of requests that meet a predefined performance threshold. Monitoring the Apdex score helps you gauge overall user satisfaction with your application.
12. Session Duration and User Engagement
For applications where user engagement is key, monitoring session duration and how users interact with the application can provide valuable insights. This data helps you understand user behaviour, optimize the user journey, and improve retention.
If you are focusing on frontend of the application then the key metrics would be Page Load Time, First Contentful Paint (FCP), Time to Interactive (TTI), Largest Contentful Paint (LCP), Cumulative Layout Shift (CLS), JavaScript Execution Time, First Input Delay (FID), Error Rates (JavaScript Errors), Render Time, API Response Times, User Engagement Metrics, Bounce Rate and Heatmaps.
If you are focusing on mobile app then the key metrics would be App Load Time, Time to First Interaction, App Crash Rate, Crash-Free Sessions, Battery Usage, Memory Usage, Network Latency, API Response Time, Error Rate, User Retention Rate, In-App Purchases, User Engagement Metrics, App Store Ratings and Reviews, and Push Notification Engagement.
Did I miss anything? If yes, Please help me make it better by sharing your thoughts in the comments.
👋 Let’s be friends! Follow me on Twitter and connect with me on LinkedIn. Don’t forget to Subscribe as well.