


The Founder's Guide to Website Monitoring (No Technical Experience Required)

As a founder, your website is your digital storefront - it needs to run smoothly 24/7. How are you sure it is running smoothly?
How you will find out if something goes wrong?
Monitoring its performance will help you find answers to these questions.
In this article, I will share how to do it. You can do it on your own(I mean with your team) even if you're not technically inclined.
Understanding Website Performance Monitoring
Before we dive in, imagine your website as a busy restaurant. Just as a restaurant owner needs to monitor both the dining room experience and the kitchen operations, you need to watch both what your users experience and how your technical systems are performing. If you try to monitor everything at once, you'll get overwhelmed - like trying to watch every table, the kitchen and the entrance simultaneously. Let's break it down into manageable parts.
Part 1: Monitoring Your Users' Experience
This is like checking how customers experience your restaurant from the moment they walk in until they leave. Here's how to do it:
For B2C Websites:
PageSpeed Insights is your best friend here. Think of it as a secret critic who tests everything about your website's performance.
You can do it by following these steps:
Visit pagespeed.web.dev
Enter your website's address
I am giving here my habit project URL (piptrends.com) to show you how it looks like. See the picture below. My performance score is 80. Right now I will worry about this only.

The tool gives you a score out of 100. Aim for a score above 90
The best part is this tool will provide specific recommendations, such as:
Making images load faster (like ensuring your menu photos aren't too heavy)
Reducing wait times (like speeding up how quickly your homepage appears)
Improving mobile experience (like making sure everything works well on phones)
Of course, checking regularly is the best option to improve your customers’ experience. Write a small script for getting PageSpeed Insights using its API. All those details you will find here - https://developers.google.com/speed/docs/insights/v5/get-started
For Membership/Login-Required Websites:
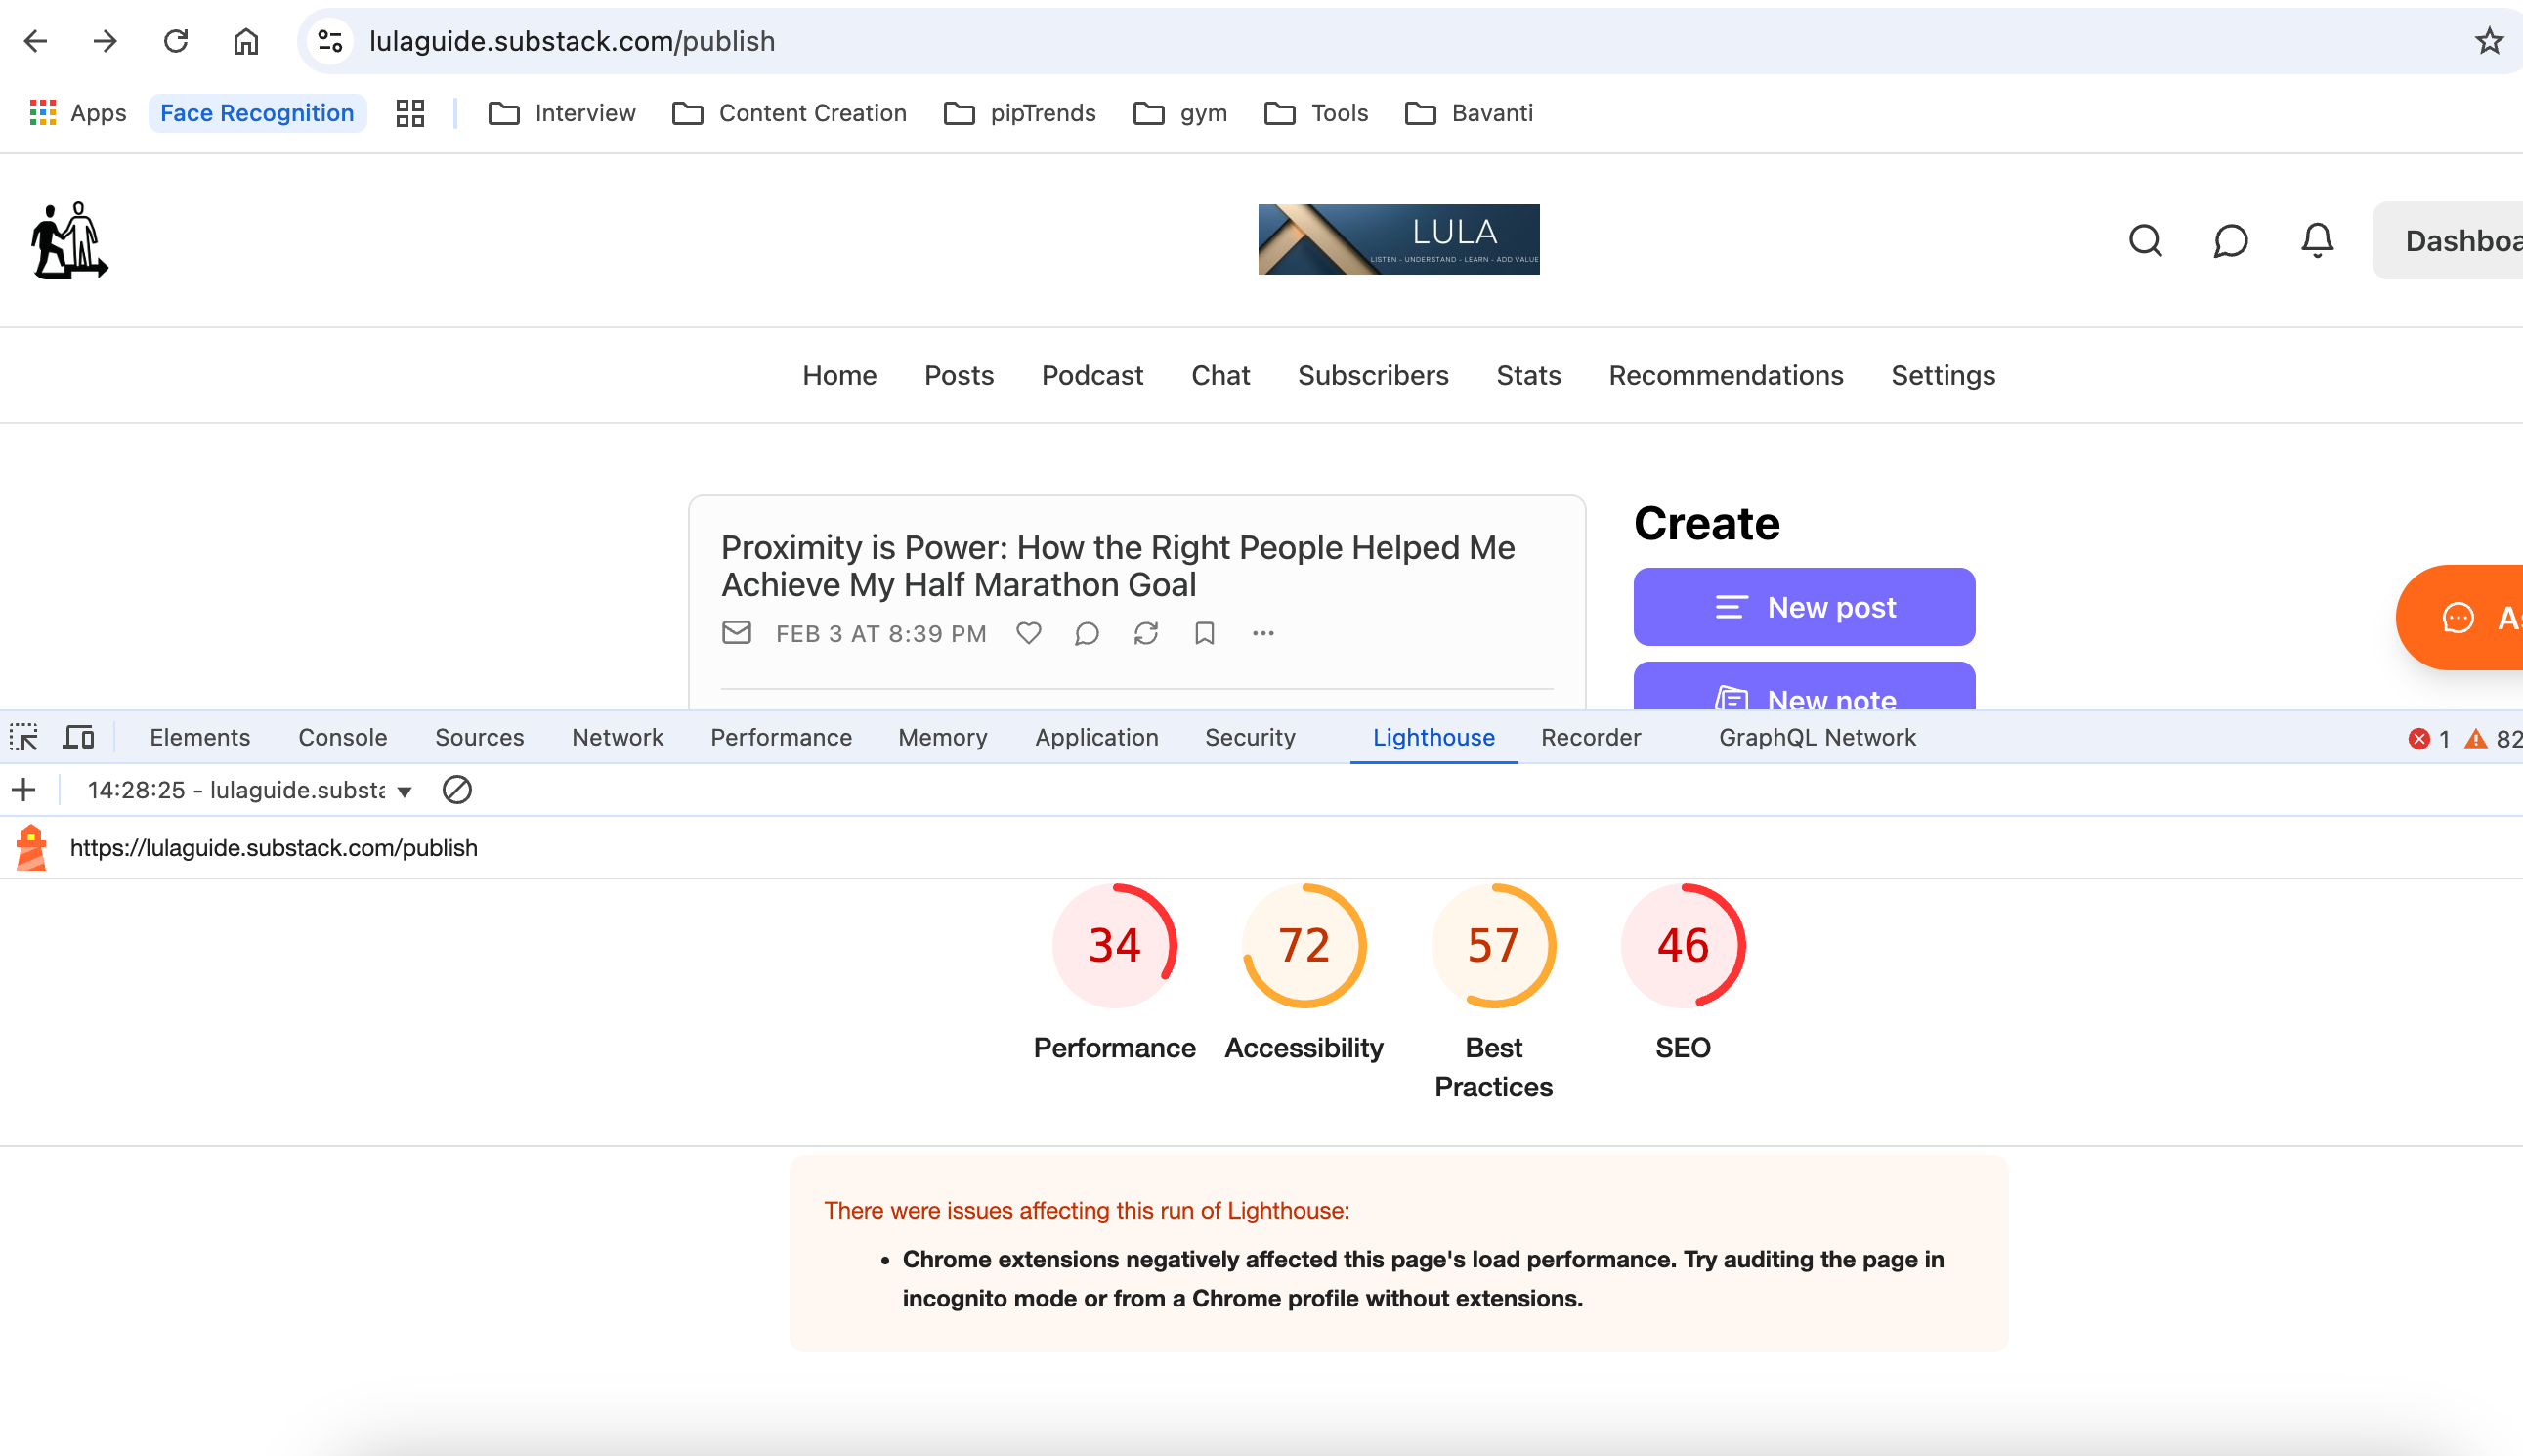
For these types of sites (called SaaS applications), you'll need a different approach using the Lighthouse Chrome extension. Here's how to use it:
Install the Lighthouse extension in your Chrome browser
Visit the page you want to check
Right-click anywhere on the page
Click "Inspect" (don't worry if you see complex code)
Look for the "Lighthouse" tab
Click "Analyze Page Load"
Wait for the report to generate
Review the same kinds of scores and recommendations as PageSpeed Insights
It looks like this
Part 2: Monitoring Your Website's Technical Performance
This is like monitoring your restaurant's kitchen and support systems. If you're using cloud services (AWS, Google Cloud, or Azure), they provide monitoring dashboards. For starters that is a good place to start. Start from the Load Balancer Dashboard.

I will cover some of the main ones, what to watch and why it matters:
1. Target Response Time (Speed Check):
Target: Keep it under 300 milliseconds (less than half a second)
Why it matters: If your website is slow, you'll lose customers just like a slow restaurant loses diners
What to check if it's too slow:
Server Usage: Is your computer server working too hard? (Check CPU usage)
Memory Usage: Does your server have enough working memory?
Storage Space: Is your hard drive getting full?
Database Speed: Are your data requests processing quickly?
If you're using basic server options (like AWS T Series/GCP Shared Core VMs/Azure B-Series), check your "CPU credits" - think of these like a power allowance that can run out.
2. Error Monitoring (Problem Alerts):
Let's understand each type of error:
a) 5XX Errors (Target 5XXs):
What they mean: Some of the pages/APIs of your website are broken in some way
Common causes: Server crashes, code problems, or system overload
Action needed: Immediate attention from your technical team
b) 4XX Errors (Target 4XXs):
What they mean: Users are trying to access things that don't exist or aren't allowed
Common causes:
Broken links
Missing pages
Users trying to access restricted areas
Permission problems
Actions needed: Check Google Search Console for broken links and fix them. Check the permission problems or bad actors.
c) 3XX Errors (Target 3XXs):
What they mean: Your website is redirecting users too much
Why it matters: Too many redirects slow down your site and can hurt your Google rankings
Action needed: Check Google Search Console or Consult with an SEO expert to fix old links
3. Traffic Spikes (Requests):
Watch for sudden increases in visitors
If you see regular spikes (like during lunch hour/daytime), you might need "auto-scaling" - automatically adding more server power during busy times
When to Upgrade Your Monitoring
If you keep having performance problems, it's time to consider Full-stack application monitoring. Think of these like installing a sophisticated restaurant management system. Options include:
New Relic
Datadog
AppDynamics
These tools are more complex but provide detailed insights into:
Which parts of your code are causing problems
How your database is performing
Real-time user experience monitoring
Simple process to Get Started
1. Daily Checks:
Look at your response times
Check for any error spikes
Monitor server resource usage
Run PageSpeed Insights or Lighthouse tests
2. Weekly Checks:
Review error patterns
Review Slow Queries. (Almost all the databases have this feature to log slow queries. Configure it)
Check if you need more server resources
3. Monthly Reviews:
Analyze trends in all metrics
Plan improvements based on data
Just like a restaurant owner doesn't need to be a master chef to run a successful restaurant, you don't need to be a technical expert to ensure your website runs well. Focus on understanding these basic metrics and don't hesitate to bring in experts when needed.
Still struggling and need help please DM me on LinkedIn